

If your games stutter after twenty minutes, your fans spin up like a jet engine, or your PC shuts off mid-match, your graphics card temperature is the first number you should check. It’s a two-minute job, no screwdriver required. This walkthrough shows you exactly how to read your GPU temperature, what the numbers mean, and what to do when they climb higher than they should. Whether you own a bargain card or you’re eyeing the best GPU deals for an upgrade, knowing your thermals keeps performance stable and your hardware alive longer. Modern GPUs will throttle themselves to avoid damage, so a hot card doesn’t usually die, it just gets slow and loud. That’s the symptom we’re chasing down here.
You don’t need paid software or deep technical knowledge. Windows 10 and 11 include a built-in reading, and free tools fill in the rest. Let’s get your numbers on screen.
What you’ll need
Almost nothing, honestly. A Windows PC with a discrete or integrated GPU, and one free monitoring app if you want detail beyond the basics. The tools worth grabbing are Task Manager (already installed), HWMonitor or HWiNFO for sensor logging, MSI Afterburner for an in-game overlay, and GPU-Z if you want a single-screen snapshot of everything your card reports. All four are free. None take more than a minute to install.
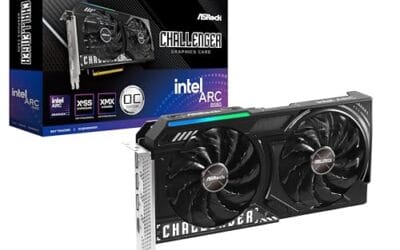
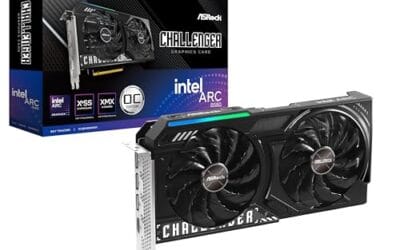
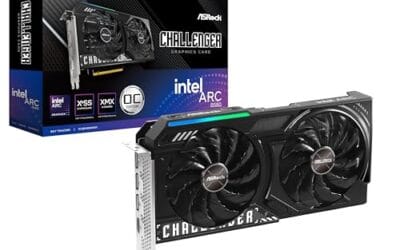
Hardware itself matters too. A card with a strong cooler runs cooler under the same load, which is why thermal design shows up in reviews so often. The ASRock Intel Arc B580 Challenger 12GB OC, for example, ships with dual fans and a 0dB silent mode that stops the fans entirely at idle, and it carries a 4.3 rating at $309.99. Its Xe2-HPG core clocks to 2740MHz with 12GB of GDDR6 on a 192-bit bus, so it’s a genuinely capable 1440p card that stays quiet when it isn’t working hard. If you’re shopping while you diagnose, it’s a reasonable reference point for what a modern midrange cooler looks like.

Pros
- 12GB VRAM on 192-bit bus gives headroom over8GB rivals at 1440p.
- Single 8-pin connector and 650W PSU target means broad build compatibility.
- DisplayPort 2.1 with UHBR13.5 suports high-refresh QHD and 4K panels natively.
- 2-slot 249mm length fits compact ATX and many mATX chassis without clearance issues.
Cons
- Limited owner feedback at time of writing makes long-term reliability signals thin.
- PCIe 4.0 x8 interface can bottleneck slightly on older PCIe 3.0 platforms.
- Intel Arc driver maturity in older DX9/DX11 titles still trails NVIDIA and AMD.
The ASRock Arc B580 Challenger 12GB OC is a mid-range 1440p GPU built on Intel's Xe2-HPG architecture with 20 Xe cores, 160 XMX engines, and a 2740MHz boost clock. It targets QHD gamers and content creators who want more VRAM than 8GB competitors offer at this bracket, without moving up to a 200W-plus card.
The defining feature is the 12GB GDDR6 pool on a 192-bit bus running at 19 Gbps, which gives real texture and framebuffer headroom at1440p. Combined with XeSS 2 AI upscaling and DirectX 12 Ultimate support, Arc B580 cards in this tier typically handle modern raster titles at high settings QHD, based on Intel's reference silicon behavior.
Trade-offs are typical for Intel Arc at this stage. The PCIe 4.0 x8 interface can shave frames on PCIe 3.0 boards, and driver polish on legacy DX9/DX11 games still lags competing vendors. The card requires a single 8-pin, 650W recommended PSU, and 249mm length, so verify chassis clearance and rail headroom before pairing with older bronze-tier supplies.
Buy this if you want a 1440p card with 12GB VRAM, DP 2.1 outputs, and XeSS 2 support on a modern PCIe 4.0 platform. Skip this if your library leans heavily on older DirectX 9 or 11 titles, or your motherboard is PCIe 3.0.
Resolution target: With 12GB GDDR6 on a 192-bit bus at 19 Gbps, this card is positioned for 1440p high settings in modern raster titles, with XeSS 2 upscaling extending playable framerates in heavier ray-traced workloads. 1080p esports at high refresh is well within scope.
Power and PSU pairing: ASRock lists a 650W recommended PSU and a single 8-pin connector. GPUs in this class typically draw around 190W board power, so pair with a quality 650W to 750W unit to leave transient headroom on ATX 3.0 or olderATX 2.x rails.
Build clearance: The2-slot cooler measures 249mm long, 132mm wide, and 41mm high. That fits most mid-towers and many mATX cases, but confirm front-radiator or HDD-cage clearance in compact builds beforeordering, especially SFF chassis rated under 250mm GPU length.
Display outputs: Three DisplayPort 2.1 ports (one primary up to UHBR13.5) plus one HDMI 2.1a drive up to four displays with resolutions up to 8K. UHBR13.5 suports high-refresh 4K and 1440p panels natively without DSC compromises.
Step 1: Open Task Manager for the quick reading
Right-click your taskbar and choose Task Manager, or press Ctrl+Shift+Esc. Click the Performance tab, then select your GPU from the left column. Windows shows a live temperature reading near the bottom of that panel, updated every second. That’s it. No download, no config.
This built-in reading works on Windows 10 and 11 with current graphics drivers, and it’s the quickest sanity check there is. If Task Manager doesn’t show a temperature at all, your driver is likely outdated, so update it through GeForce Experience, AMD Adrenalin, or Intel’s Arc Control before moving on. The catch with Task Manager is that it only shows the current instant. It won’t log your peak temperature during a long session, and it won’t tell you the temperature of individual hotspots on the die. For that, you need a dedicated tool.
One habit worth building here: check your idle temperature first, then remember it. A card sitting on the desktop should read somewhere between 30 and 50 degrees Celsius depending on room temperature and case airflow. If your idle number is already sitting at 60 or 70 degrees, you’ve found a cooling problem before you’ve even loaded a game. That baseline gives every later reading context.
Step 2: Install a monitoring app for detail
Download HWiNFO or HWMonitor. Both are free, both are trusted across the PC community, and both expose far more than Task Manager does. After installing, launch the app and scroll to your GPU section. You’ll see several temperature values, and the naming trips up a lot of people, so here’s the plain version.
“GPU Temperature” (sometimes “GPU Core”) is the main die reading, the number most guides refer to. “GPU Hot Spot” or “Junction” is the hottest single point on the chip, which normally runs 10 to 20 degrees Celsius above the core. “Memory Junction” tracks your VRAM, and that one matters on higher-end cards pushing heavy 4K workloads. Don’t panic when the hot spot reads higher than the core. That gap is expected and by design.
HWiNFO in particular lets you open a dedicated sensors window and pin just the values you care about, which keeps the screen readable. If the sheer number of readouts feels overwhelming, GPU-Z is the friendlier option. It puts your core temperature, fan speed, clock, and power draw on a single tidy tab, and its Sensors page updates live. Pick whichever one you’ll actually open again next month. Consistency beats feature count when you’re tracking a card over time.
Step 3: Read the temperature under real load
An idle temperature tells you very little. Your card sits cool doing nothing. What you actually care about is the number under sustained load, because that’s when throttling and instability show up. So put the card to work. Launch a demanding game and play for fifteen to twenty minutes, or run a graphics stress utility like FurMark or 3DMark if you’d rather not fire up a title.
While the load runs, watch your monitoring app or use an overlay so you don’t have to alt-tab. Note the peak temperature, not the average, since the peak is what triggers throttling. Run the same workload a couple of times and compare peaks, because a single bad reading can mislead you, and consistency across runs is what tells you the card has a real cooling problem rather than a one-off warm afternoon. For most gaming cards, a core temperature between 65 and 85 degrees Celsius under load is completely normal and safe. Hot spot readings up to roughly 95 to 100 degrees are within spec on many modern cards, though you’d prefer to stay below that. This is also the moment where a heavy workload separates cards, and it’s why enthusiasts pushing the best GPU for 4K gaming or a high-refresh 1440p build pay such close attention to cooler quality before buying.
Step 4: Set up an in-game overlay
Alt-tabbing to check numbers is clumsy and it changes the load anyway. An overlay solves this by drawing your temperature straight onto the game screen. MSI Afterburner paired with RivaTuner Statistics Server is the standard here, and it works with any brand of card, not only MSI hardware.
Install Afterburner, open its settings, go to the Monitoring tab, and tick “Show in On-Screen Display” for GPU temperature. You can add core clock, fan speed, and usage percentage to the same overlay. Now the numbers live in the corner of your screen during every session. This is the setup competitive players and streamers lean on, since anyone running the best GPU for gaming and streaming wants to watch thermals climb in real time while encoding hammers the card. Set it once and forget it.
Step 5: Log a session and check for throttling
The final step separates a casual glance from a real diagnosis. In HWiNFO, enable logging before you start a long gaming session, then review the maximum column afterward. You’re looking for two things. First, whether your peak core temperature crept above the mid-80s. Second, whether your clock speed dropped when the temperature rose, which is the fingerprint of thermal throttling.
If your card held 2600MHz early and sagged to 2100MHz an hour in while temperatures hit 88 degrees, that’s throttling, and it’s costing you frames. A healthy card holds its clocks steady with temperatures in a stable band. If yours doesn’t, the troubleshooting section below is where you head next. Logging also helps when you’re comparing a used card’s health before you buy, or validating that a recent cooler upgrade actually did something measurable.
Ambient room temperature factors in too, and people forget it constantly. A card that peaks at 78 degrees in winter can easily hit 85 in a warm summer room with no case changes at all. So if your numbers crept up seasonally rather than suddenly, the card is probably fine and your room just got hotter. Compare readings taken under similar conditions. A five-degree swing between a cold morning and a stuffy afternoon isn’t a fault, it’s physics doing its job.
Troubleshooting common issues
Numbers looking wrong? Here are the failures that show up most, and how to sort each one.
Temperature reads 90C or higher under load
Start with airflow. Check that your case fans spin and that intake vents aren’t choked with dust. A can of compressed air on the GPU heatsink and fans fixes a surprising number of these cases, since dust buildup is the single most common cause of rising temperatures over a card’s life. Hold the fan blades still with a finger while you blow air through, so they don’t spin freely and backfeed voltage into the board. If the card is several years old, the thermal paste between the die and heatsink may have dried out, and a repaste can drop temperatures by 10 degrees or more. That’s an advanced job, so weigh it against the card’s value.
Fans don’t spin at all
Many modern cards, including the ASRock Arc B580 mentioned earlier, use a 0dB or zero-RPM mode that keeps fans off below a certain temperature. So idle silence is usually normal, not a fault. If the fans stay off once the card passes 60 degrees under load, that’s a problem. Update your drivers first, then set a custom fan curve in Afterburner to force earlier spin-up.
Task Manager shows no temperature
This is almost always a driver issue. Reinstall the latest graphics driver directly from Nvidia, AMD, or Intel rather than relying on Windows Update, which often lags behind. Older cards on legacy drivers sometimes never report to Task Manager, in which case GPU-Z or HWiNFO will still read the sensor fine.
Temperatures spike then the PC shuts off
A hard shutdown under load points to either extreme heat hitting the emergency cutoff around 100 to 105 degrees, or a power supply that can’t hold up. Confirm the temperature first with logging. If the card cuts out well below its thermal limit, the PSU is the more likely culprit, and undersized power is a classic pitfall for anyone chasing the best GPU under 500 without upgrading the rest of the system to match.
Wrapping up
Checking your GPU temperature takes two minutes with Task Manager and gives you real detail once you add HWiNFO and an Afterburner overlay. Aim for a load temperature under the mid-80s Celsius, watch your clocks for throttling, and clean the dust out once or twice a year. Do that and your card stays fast, quiet, and healthy for years. Once you can read these numbers confidently, every future build or troubleshooting session gets easier, because you’ll know what normal looks like for your specific setup. If your readings confirm the card is simply outmatched by newer titles rather than overheating, that’s a different fix, and browsing something like the best GPU for a 9800X3D build or a flagship from the best GPU under 1000 tier is the honest next move. Either way, you now know exactly what your card is doing under the hood.





Write Your Review
No reviews yet. Be the first to share your experience!